


In the dynamic world of trading and investing, two primary schools of thought emerge: fundamental analysis and technical analysis. The concept of fundamental analysis goes deep into the basics of a security or project’s value by examining financial trends and management performance.
In contrast, technical analysis shifts focus away from the basics to study the intricacies of price movements, trading volume, and what causes the varying prices of financial instruments.
This blog post delves into the underlying principles of technical analysis, its tools, uses, benefits, and drawbacks, providing you with a thorough understanding of this vital trading method.
What exactly is technical analysis?
Technical analysis is a way of making informed predictions about future prices. Movements of securities—such as stocks, commodities, or currencies—by analysing past market data, primarily price and volume. During trading, you can use past price actions to make calculated predictions that can estimate the exact prices of different securities.
Certain facts that technical analysts believe
1. Market Efficiency: Technical analysts believe that all the presumptions they gather from studying the fundamentals of a project/ security are summed up in the price actions of that security. They believe that a security’s value is majorly tied to its past prices and trading volumes.
2. Price Trends: Technical analysis also suggests that once a token, security, or project establishes a trend, it will just repeat it instead of attempting to reverse it. Therefore, a security value is tied to the established price trends, and it is only better to work in that direction.

Image from Pinterest
3. Historical Patterns: Market conduct tends to repeat itself as a result of aggregated psychology among people. Traders’ reactions to market situations frequently reflect previous behaviours, resulting in established trends over the years.
Also Read: Who stockbrokers are and how they operate
Technical Analysis Tools and Instruments
Technical analysts utilise a variety of tools to identify trends and price movements. The following are some of the most widely used methods:
1. Charting Techniques
Candlestick charts visually represent how prices have varied within specific time frames. Each candlestick shows the opening, closing, and high and low prices during that period. Candlestick patterns, such as doji and gravestone doji, can indicate market indecision or potential reversals.

Image from forexbee
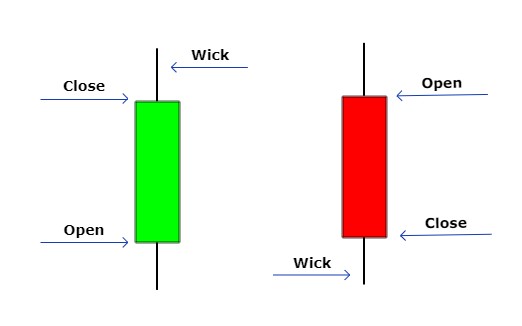
Bar and Line Charts: While candlestick charts are popular for their detailed information, bar and line charts also serve to track price movements over time. Line charts, in particular, offer a clear view of the closing prices.

2. Technical Indicators
Technical indicators use statistical calculations based on the volume of the data and historical price. Some of the most common indicators include:
Moving averages (MA) smooth out price data to assist spot patterns over a certain time period. For example, a simple moving average (SMA) determines the average price over a defined number of periods, but the exponential moving average (EMA) focuses on the latest values.

Charting a 50-Day Simple Moving Average. Image by Sabrina Jiang © Investopedia 2021
Momentum Indicators: These indicators, such as the Relative Strength Index (RSI) and Moving Average Convergence Divergence (MACD), measure the strength of price moves, assisting traders in identifying probable reversals.
Support and Resistance Levels: These levels show where prices have typically struggled to go above (resistance) or below (support). Traders frequently watch for breakouts or rebounds at these important levels.
Bollinger Bands: These bands consist of a moving average and two standard deviations, resulting in a range in which prices normally move. When prices reach the upper or lower bands, it may indicate overbought or oversold circumstances.
Also Read: Stock Market: The Basics, Rules, and Success Tools
3. Chart Patterns
Technical analysts also identify specific formations on charts that can indicate future price movements. These patterns include:
Head and Shoulders: This reversal pattern indicates a probable shift in trend direction, with the “head” being a high sandwiched between two lesser peaks (shoulders).

Triangles: Depending on converging price movement, ascending, falling, and symmetrical triangles might point to probable breakout directions.

Flags and Pennants: These continuation patterns form after a major price movement and indicate that the previous trend may return following a brief consolidation.
Application of Technical Analysis
Technical analysis is widely used in a variety of asset types, including stock, commodity, and Foreign Exchange markets. Here are some practical uses.
1. Short-Term Trading
Intra-day traders often rely heavily on technical analysis to make quick decisions based on small price movements. By using short time frames (such as 5-minute or 15-minute charts), traders can capitalise on fleeting opportunities.
2. Swing Trading
Swing traders aim to capture price swings over several days or weeks. They often use daily charts and technical indicators to identify entry and exit points that align with short to medium-term trends.
3. Long-Term Investing
While technical analysis is commonly linked with short-term trading, it may also be useful for long-term investors. Using weekly or monthly charts, investors may spot larger market patterns and potential entry chances during corrections or pullbacks.
Advantages of Technical Analysis
- Market mood Analysis: Technical analysis is a useful tool for capturing trader psychology and market mood, both of which can affect price movements.
- Trend Identification: Technical analysts may increase profitability by using trend recognition to help them decide when to enter or leave trades.
- Broad Applicability: Technical analysis is adaptable to many markets, as it can be used on any security with historical data.
- Self-Fulfilling Prophecy: Since numerous traders employ comparable technical indicators, their combined activities may reinforce price movements, increasing the dependability of particular patterns.
Technical Analysis’s Drawbacks
Technical analysis has drawbacks despite its benefits:
- Subjectivity: diverse analysts may have diverse interpretations of the same charts, which might result in different tactics and conclusions.
- No Guarantees: Unpredictable market occurrences have the potential to upset established trends, and past performance does not guarantee future outcomes.
- Self-Fulfilling Prophecy Risks: Although self-fulfilling prophecies have benefits, they may also lead to an excessive dependence on particular indicators, which could result in large losses if the market exhibits unexpected behaviour.
- Ignoring Fundamentals: Relying exclusively on technical analysis may lead to the neglect of important elements that have a big influence on a security’s price, including economic statistics or earnings reports.
Technical Analysis vs. Fundamental Analysis
Fundamental analysis examines financial conduct and external economic variables, whereas technical analysis concentrates on price fluctuations and patterns. Here is a quick comparison:
Technical analysis focuses on past price data, market movements, and trading conduct. Short-term traders who want immediate indications for prompt decision-making frequently use it.
Fundamental Analysis examines financial statements, market dynamics, and economic indicators to determine a security’s inherent worth. It is preferred by long-term investors who want to know a company’s actual value.
Conclusion
Technical analysis is a valuable tool for traders and investors. It provides insights into market patterns and price movements and helps make informed decisions using various charting tools, indicators, and patterns. However, it’s essential to integrate technical research with fundamental insights for a comprehensive investing plan. Mastering technical analysis can enhance trading skills and increase success in constantly changing financial markets.
Leave a Reply